

Matplotlib
keyboard_arrow_down 83 guides
chevron_leftColors Cookbook
Adding multiple plots with different colorsChanging background color of figureChanging color based on valueChanging line color of a plotChanging the background color of a plotChanging the color of axesChanging the color of tick labelsDrawing semi-transparent plotsFilling in the area above a curveFilling in the area underneath a curveGetting specific color value from a color mapInverting color mapsMaking the background figure transparentShading an area
check_circle
Mark as learned thumb_up
0
thumb_down
1
chat_bubble_outline
0
Comment auto_stories Bi-column layout
settings
Filling in the area above a curve in Matplotlib
schedule Aug 10, 2023
Last updated local_offer
Tags Python●Matplotlib
tocTable of Contents
expand_more Master the mathematics behind data science with 100+ top-tier guides
Start your free 7-days trial now!
Start your free 7-days trial now!
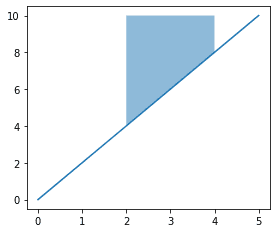
To fill in the area above a curve in Matplotlib, use the plt.fill_between(~) method:
                    x = np.linspace(0, 5, 1000)plt.plot(x, 2*x)
# Fill area above curvex_fill = np.linspace(2, 4, 1000)plt.fill_between(x_fill, 2*x_fill, y2=10, alpha=0.5)plt.show()
Here, the four parameters we are supplying to the fill_between(~) method are as follows:
The x-values to shade
The lower bound of the y-values to shade
The upper bound of the y-values to shade
The transparency of the shaded area
This gives us the following:
Published by Isshin Inada
Edited by 0 others
Did you find this page useful?
thumb_up
thumb_down
Comment
Citation
Ask a question or leave a feedback...
thumb_up
0
thumb_down
1
chat_bubble_outline
0
settings
Enjoy our search
Hit / to insta-search docs and recipes!