

Matplotlib
keyboard_arrow_down 83 guides
chevron_leftLegend Cookbook
check_circle
Mark as learned thumb_up
0
thumb_down
0
chat_bubble_outline
0
Comment auto_stories Bi-column layout
settings
Adding a legend to a plot in Matplotlib
schedule Aug 12, 2023
Last updated local_offer
Tags Python●Matplotlib
tocTable of Contents
expand_more Master the mathematics behind data science with 100+ top-tier guides
Start your free 7-days trial now!
Start your free 7-days trial now!
Pyplot interface
To add a legend to a plot in Matplotlib:
                    import matplotlib.pyplot as plt
plt.plot([1,2,3], label="blue", color="blue")   # add the label parameter hereplt.plot([3,2,1], label="red", color="red")     # add the label parameter hereplt.legend()   # to embed the legendplt.show()
This produces the following:
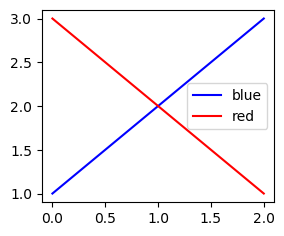
By default, Matplotlib will place the legend where there is minimal overlap.
Changing the legend's location
You can change the location of the legend by specifying the loc parameter:
plt.legend(loc="upper left")plt.legend(loc="upper right")plt.legend(loc="lower left")plt.legend(loc="lower right")
NOTE
For large amounts of data, you may want to specify the location.
By default, Matplotlib places the legend where there is minimal overlap. If you have large amounts of data, this process may be too slow, in which case you should explicitly specify the legend location.
Changing the font size
To change the font size of the legend, pass in the fontsize parameter to plt.legend(~) like so:
plt.legend(fontsize=20)
Object-oriented interface
To add a legend to a plot in Matplotlib using the object-oriented interface:
fig, ax = plt.subplots()ax.plot([1,2,3], label="blue", color="blue")ax.plot([3,2,1], label="red", color="red")ax.legend()plt.show()
This produces the following:
Published by Isshin Inada
Edited by 0 others
Did you find this page useful?
thumb_up
thumb_down
Comment
Citation
Ask a question or leave a feedback...
thumb_up
0
thumb_down
0
chat_bubble_outline
0
settings
Enjoy our search
Hit / to insta-search docs and recipes!