

Matplotlib
keyboard_arrow_down 83 guides
chevron_leftText, Label and Annotations Cookbook
Adding a title to a plotAdding arrows to an annotationAdding axis labels to a plotAdding markers to a plotAnnotating data pointsApplying an offset to annotationsChanging the default font sizeChanging the marker size in scatterplotsChanging the number of ticksChanging the tick sizeRemoving certain ticksRemoving column name label from pie chartsRemoving default axis labelsRotating axis labelsRotating custom tick labelsSpecifying custom tick labelsWriting mathematical expressions
check_circle
Mark as learned thumb_up
1
thumb_down
0
chat_bubble_outline
0
Comment auto_stories Bi-column layout
settings
Annotating data points in Matplotlib
schedule Aug 12, 2023
Last updated local_offer
Tags Python●Matplotlib
tocTable of Contents
expand_more Master the mathematics behind data science with 100+ top-tier guides
Start your free 7-days trial now!
Start your free 7-days trial now!
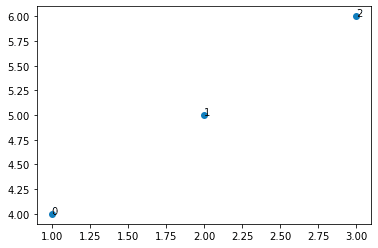
To annotate data points in Matplotlib, use the annotate(~) method:
                    import matplotlib.pyplot as plt
x = [1,2,3]y = [4,5,6]plt.scatter([1,2,3], [4,5,6])for i in range(len(x)):    # The 1st argument is the annotation label, 2nd is the coordinate of the annotation    plt.annotate(i, (x[i], y[i]))
This produces the following:
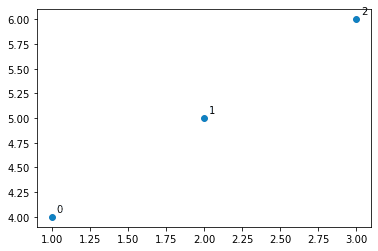
Applying an offset
With the default settings, the annotations do not look great; the annotations overlap with our data points. To fix this, we can apply an offset like so:
x = [1,2,3]y = [4,5,6]plt.scatter([1,2,3], [4,5,6])for i in range(len(x)): plt.annotate(i, (x[i], y[i]), xytext=(5, 5), textcoords="offset pixels")
Here, we are setting two additional parameters xytext and textcoords. The textcoords indicates that we want to apply the offset in units of pixels, and the xytext indicates how much we want to offset the annotations by. The xytext takes in a tuple, with the first item being the horizontal offset, and second being the vertical offset.
The output is as follows:
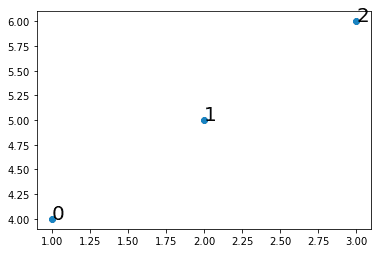
Changing the font-size
To change the font-size of the annotation, specify the fontsize argument:
import matplotlib.pyplot as pltx = [1,2,3]y = [4,5,6]plt.scatter([1,2,3], [4,5,6])for i in range(len(x)): plt.annotate(i, (x[i], y[i]), fontsize=20)
This produces the following plot:
Published by Isshin Inada
Edited by 0 others
Did you find this page useful?
thumb_up
thumb_down
Comment
Citation
Ask a question or leave a feedback...
thumb_up
1
thumb_down
0
chat_bubble_outline
0
settings
Enjoy our search
Hit / to insta-search docs and recipes!