

Drawing a scatterplot in Matplotlib
Start your free 7-days trial now!
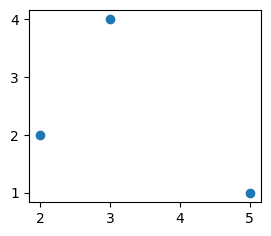
Using the scatter function
To draw a basic 2D scatter plot in Matplotlib, we could use the scatter(~) function like so:
fig, ax = plt.subplots()ax.scatter([5,2,3], [1,2,4])plt.show()
The first argument is an array of your xs, and the second is an array of your ys.
This produces the following:
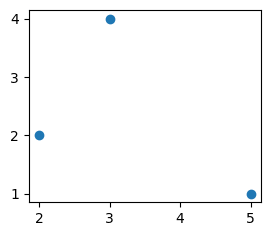
Using the plot function
To draw a basic 2D scatter plot in Matplotlib, we could also use the plot(~) function like so:
plt.plot([5,2,3], [1,2,4], "o")plt.show()
Here, the third argument "o" indicates that you don't want the data points to be connected. This is needed since the default behavior is to connect the dots.
This produces the following:
Customizing our plots
Both the scatter(~) and plot(~) methods allow for flexible customization.
Marker size
Pass in the markersize parameter for plot(~) and the s parameter for scatter(~):
plt.scatter([3,4],[5,6], s=10)plt.plot([3,4],[5,6], markersize=10)
Marker color
Pass in the color parameter for both plot(~) and scatter(~):
plt.plot([3,4], [5,6], color="r")plt.plot([3,4], [5,6], color="red")plt.plot([3,4], [5,6], color="#FF0000")plt.plot([3,4], [5,6], color=(1,0,0)) # Warning: this isn't your typical (0-255) interval
Marker style
Pass in the marker parameter for both plot(~) and scatter(~):
plt.scatter([1], [1], marker="*", s=300) # starplt.scatter([1], [2], marker="o", s=300) # circleplt.scatter([1], [3], marker="+", s=300) # plusplt.scatter([2], [1], marker="^", s=300) # triangleplt.scatter([2], [2], marker="D", s=300) # diamondplt.scatter([2], [3], marker="s", s=300) # square
This produces the following:
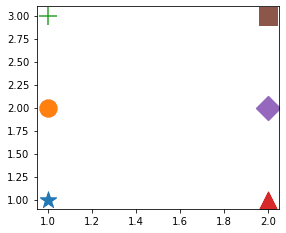
The colors are automatically chosen by Matplotlib.
Difference between functions scatter and plot
Both functions can be used to draw scatter plots, but the difference is that the plot(~) function is more efficient but less flexible than the scatter(~) function. The plot(~) function does not allow for customization of individual points (e.g. changing color and size), while the scatter(~) allows for this. The implication of such a difference is that the plot(~) function has far less jobs to handle, making it more efficient.
As a rule of thumb, if you do not need to customize individual points, then opt for the plot(~) function.