Drawing a vertical line in Matplotlib
Start your free 7-days trial now!
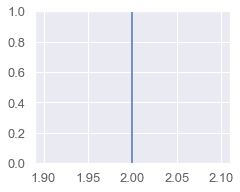
To draw a vertical line in Matplotlib, use the axvline(~) function like so:
plt.axvline(x=2)
The output is as follows:
Changing the color
To change color of the line, add the color parameter:
color="red" color="#FF0000"
Changing the line style
To change the styling of the line, add the linestyle parameter:
linestyle="dotted"linestyle="dashed"
Specifying starting and ending points
By default, the line drawn by axvline(~) spans the entire height of the graph.
ymin and ymax
You could change this behaviour by specifying parameters ymin and ymax, both of which must be a number between 0 and 1.Here, 0 represents the bottom of your graph, while 1 represents the top of your graph.
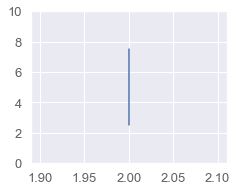
To draw a vertical line from bottom 25% to top 75%:
plt.ylim(0, 10)plt.axvline(x=2, ymin=0.25, ymax=0.75)
The output is as follows:
y-coordinates
Unfortunately, the axvline(~) method does not accept starting and ending y-coordinates. We can instead resort to the plt.plot(~) function, which does allow for y-coordinates.
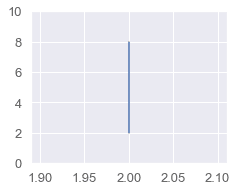
To draw a vertical line from y=2 to y=8 at x=5:
plt.ylim(0, 10)plt.plot([2,2], [2,8])
The output is as follows: