

Matplotlib
keyboard_arrow_down 83 guides
chevron_leftGraphs Cookbook
Drawing a bar chartDrawing a box plotDrawing a functionDrawing a histogramDrawing a horizontal lineDrawing a line plotDrawing a normal curveDrawing a scatterplotDrawing a single pointDrawing a stacked bar chartDrawing a vertical lineDrawing arrowsDrawing circlesDrawing empty circlesDrawing error barsDrawing horizontal bar plotsDrawing multiple histograms in one plotNormalizing a histogramPlotting scatter plot with category
check_circle
Mark as learned thumb_up
2
thumb_down
1
chat_bubble_outline
0
Comment auto_stories Bi-column layout
settings
Drawing arrows in Matplotlib
schedule Aug 12, 2023
Last updated local_offer
Tags Python●Matplotlib
tocTable of Contents
expand_more Master the mathematics behind data science with 100+ top-tier guides
Start your free 7-days trial now!
Start your free 7-days trial now!
In Matplotlib, use the arrow(~) method to draw arrows:
            filter_none
            Copy


                    plt.xlim(-5,5)plt.ylim(-5,5)
# (starting_x, starting_y, dx, dy, ...)plt.arrow(-2, -1, 3, 5, head_width=0.5, head_length=0.5, color='black')plt.show()
This generates the following:

The line (without the arrow) begins at (-2,-1) and ends at (-2+3,-1+5)=(1,4). However, the presence of the arrow makes the length of the line a slightly longer. To make the arrow end at the specified endpoint (i.e. (1,4) in this case), set the parameter length_includes_head=True.
The head_width and head_length function, otherwise you will see just a line without the arrow.
Helper function to draw an arrow given starting and ending coordinate
Matplotlib asks you to provide dx and dy to plot your arrow, yet most of the time, you have the starting coordinate and ending coordinate in hand. In these cases, you might prefer to use the following helper function:
            filter_none
            Copy


                    def draw_arrow(plt, arr_start, arr_end):       dx = arr_end[0] - arr_start[0]       dy = arr_end[1] - arr_start[1]       plt.arrow(arr_start[0], arr_start[1], dx, dy, head_width=0.5, head_length=0.5, length_includes_head=True, color='black')
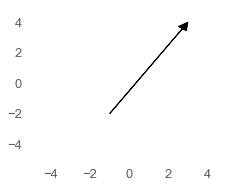
We can use the function like so:
            filter_none
            Copy


                    plt.xlim(-5,5)plt.ylim(-5,5)draw_arrow(plt, [-1,-2], [3,4])plt.show()
This generates the following:
Published by Isshin Inada
Edited by 0 others
Did you find this page useful?
thumb_up
thumb_down
Comment
Citation
Ask a question or leave a feedback...
thumb_up
2
thumb_down
1
chat_bubble_outline
0
settings
Enjoy our search
Hit / to insta-search docs and recipes!