

NumPy | interp method
Start your free 7-days trial now!
Numpy's interp(~) method computes the linear interpolated values given data points.
Parameters
1. a | array-like
The x-values you want to evaluate at.
2. xp | array-like
A one-dimensional array of x-values.
3. fp | array-like
A one-dimensional array of y-values.
4. left | float | optional
The value to return when a value in a is less than xp[0], that is, we're to the left of the bounds. By default, the first value of fp is returned.
5. right | float | optional
The value to return when a value in a is larger than xp[len(xp)-1], that is, we're to the right of the bounds. By default, the last value of fp is returned.
Return value
A Numpy array holding the y-values that have been linearly interpolated given the data points.
Examples
Basic usage
                    x_vals_to_evaluate = [1.5, 2.5, 4]x = [1,2,3]y = [1,4,2]interp_y = np.interp(x_vals_to_evaluate, x, y)
# Let's graph the interpolated y-valuesplt.plot(x,y, marker="*")plt.plot(x_vals_to_evaluate, interp_y, "o", color="red")plt.show()
This gives us the following:
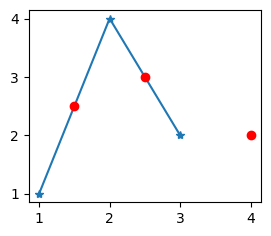
Here, the stars are the data-points we used to construct the linear relationship. The red dots represent the data points that were interpolated at the specified x=[1.5, 2.5, 4]. The corresponding interpolated y-values are as follows:
                    interp_y


            array([2.5, 3. , 2. ])
Finally, look at the red dot on the far right. We tried to interpolate at a x-value that was outside our specified x-bounds (xp), and by default, the returned y-value in this case is the last value of fp (2 in this case).
We could return an arbitrary value in this case by specifying the right parameter.